The State of Low-Wage Employment in Colorado
By Chris Stiffler, Senior Economist

Click here to read a PDF version of this report.
Introduction
While Colorado’s economy has grown at a brisk pace since the Great Recession and hundreds of thousands of new jobs have been created, a significant amount of jobs in the state barely pay enough to let those who work them make ends meet. Since low-wage jobs make up more than 1/4 of all jobs statewide, it’s important to understand who the workers that fill them are and how those jobs affect the broader economy. This report, which updates previous CFI research from 2015 and 2017, shines a light on these questions and offers some insight into how Colorado compares with other states and the rest of the country as a whole.
With the Labor Day holiday right around the corner, and as Colorado’s statewide minimum wage is set to rise once again in January of 2020 – along with local governments gaining the power to increase their own minimum wage levels above the statewide minimum – policymakers and the public should use these findings as a guide to better understand how the minimum wage works in Colorado.
Highlights
- Nearly one out of every four jobs in Colorado were low-wage jobs in 2018. This number is down from 2016, likely due to low unemployment and minimum wage increases.
- While workers who fall into the bottom 20% of earners saw their wages increase slightly when taking inflation into account, the median income fell. Meanwhile, the top 20% saw their wages rise substantially since 2000.
- Women are more likely to work in low-wage jobs than men.
- Black, Latinx, and multiracial workers are more likely to work in low-wage jobs than white workers.
- More than half of low-wage workers are between 21 and 40 years old. Workers between the ages of 25 and 54 are considered to be in their prime working years.
- Less than 25% of all workers are between the ages of 21 and 30, but that age group makes up 36% of all workers who earn low wages.
- The majority of people who work low-wage jobs do so on a part-time basis, but a plurality of workers who earn low wages work full time.
- Thanks to the passage of Amendment 70 in 2016, the minimum wage now has the same buying power as it did in the mid-1970s.
- Though Colorado’s inflation rate has outpaced inflation nationally, this is due more to the skyrocketing cost of housing than any other factor. While the price of eating out has increased slightly – due in part to the increase in the tipped minimum wage – the increase amounts to just $0.50 more for a $20 meal purchase.
What are “low-wage” jobs?
Though many people probably think of a low-wage job as one that pays minimum wage, the Colorado Fiscal Institute (CFI) defines a low-wage job as one paying less than what a full-time worker who supports a family of four would need to earn to live above the federal poverty level. The annual threshold for a low-wage job was $23,850 in 2014, which translated into an hourly wage of $12 an hour. Adjusting for inflation, that $12 threshold in 2014 is now $13.20 in 2018.
About 23 percent of jobs in Colorado are classified as low wage by that definition. Of the 2,620,640 total jobs in Colorado in 2018, 610,000 were classified as low wage. That is down from 634,000 in 2016 when 25 percent of Colorado jobs met the low-wage qualification.
The two most likely factors that explain the drop in the amount of low-wage jobs in Colorado are the historically low unemployment rate in 2017 and 2018 and moderate increases in the minimum wage over the past several years.

In 2017, Colorado’s minimum wage rose from $8.31 to $9.30. The next year it rose another 90 cents to $10.20. For much of 2017, the unemployment rate was below 3 percent, dropping as low as 2.6%. The last time unemployment was below 3 percent in Colorado was during the boom years of 1999 and 2000. As shown in Figure 1, Colorado was well below the national unemployment rate from 2016-2017 before rising slightly in 2018 as the national unemployment rate continued to fall.

Figure 2 above looks at the change in real wages of the bottom 20% of wage earners, the median, and the top 20% of wages since 2000. The rebounding real wages of the lowest 20 percent of workers is apparent. A worker earning the 20th decile wage in Colorado is 4% better off than that worker was in 2000. Unfortunately, the median wage hasn’t kept pace with inflation since 2000. Median wages in Colorado are down 2 percent in real terms since 2000. For those who are very well off, in the wealthiest 20% of earners, their wages have gone up 12 percent over the same period.
Occupational Employment Statistics, which track wage data by job instead of wage data by worker like the Current Population Survey does, show inflation-adjusted wages across the wage distribution. The impact of the rising minimum wage from $8.31 in 2016 to $10.20 in 2018 is apparent. The jobs in bottom 25 percent of wages saw the biggest growth in value between 2016 and 2018. A job paying the 10th percentile wage in Colorado saw 8.3% growth in real value – an $0.83 increase per hour. A Colorado job paying the 25th percentile wage saw a 3.1% increase – a $0.41 increase per hour. The growth in median wage barely beat inflation over those two years.

Who are the Coloradans who work low-wage jobs?
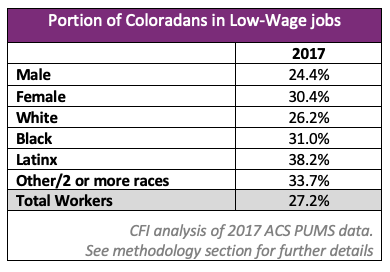
Of the 27.2% of workers who are employed in a low-wage job, women outnumber men and workers of color are more likely to work such jobs than white workers. Men, who make up 54% of the total workforce, are less than half of the total number of workers who earn low wage. Overall, 30.4% of female workers are in low-wage jobs compared to 24.4% of men. Over 30% of black and biracial workers are employed in low-wage jobs and well over 38% of Latinx workers. Latinx workers are by far the most likely race or ethnicity to earn low wages.

While a majority of workers who earn low wages are under the age of 30, it is also true that a majority of workers are between the ages of 21-40, most of whom are considered to be in their prime working age years. A disproportionately high number of workers between the ages of 21 and 30 work low-wage jobs, while a disproportionately low number of workers between 41 and 60 do so.
Coloradans who work low-wage jobs are more likely to be employed part time than those who earn higher wages. However, 56% of workers earning low wages work at least 30 hours per week, and a plurality of 44% work enough hours to be considered full-time workers.

How valuable is the minimum wage?
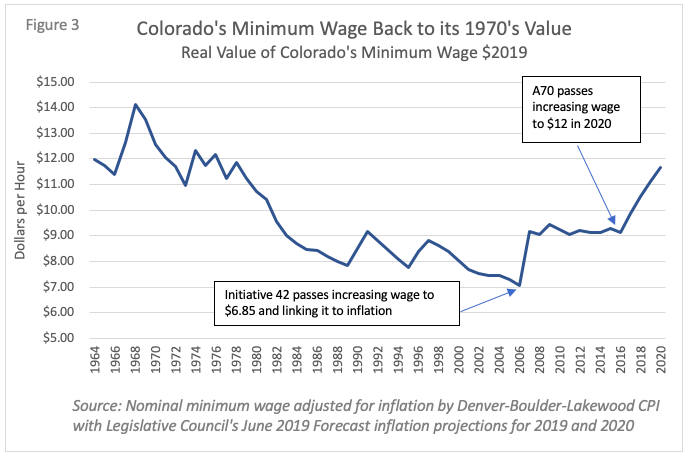
In 2006, Colorado voters added Article XVIII, section 15 to the Colorado Constitution. This amendment raised the minimum wage to $6.85 an hour from the previous level of $5.15 – also the federal level at the time – and required the minimum wage to be adjusted annually for inflation. Every year since the passage of the 2006 increase, the minimum wage rose after staying flat since 1998. 10 years later, Colorado voters passed Amendment 70, which raised the minimum wage to $9.30 in 2017 from $8.31 in 2016 and required an annual 90-cent increase until it reaches $12 in 2020.
While Colorado’s minimum wage increased by inflation after 2006, workers still lacked the buying power the state minimum wage brought those who worked low-wage jobs in the 1960s. Figure 3 below shows how the increases approved by voters drove Colorado’s inflation-adjusted minimum wage back to near-historic levels of real value. Colorado’s minimum wage of $11.10 in 2019 is still below the historic peak value, but it’s now worth about the same as it was in the mid- and late- 1970s.
How does Colorado’s minimum wage compare to other states?
Colorado currently has the 6th highest minimum wage of any state behind only California, Massachusetts, Washington, Oregon, and New York. The table below shows each state’s minimum wage compared to the median wage. Colorado has the 9th highest ratio of the minimum wage to the median wage at 55%, still below Maine’s top ratio of 64%.
|
Colorado’s
Minimum Wage in top 10 of States |
||||
|
2018
Median Wage |
2019
Minimum Wage |
Min. wage
to Median Ratio |
Rank |
|
|
Alabama |
$16.22 |
$7.25 |
45% |
29 |
|
Alaska |
$23.09 |
$9.89 |
43% |
36 |
|
Arizona |
$17.80 |
$11.00 |
62% |
2 |
|
Arkansas |
$15.31 |
$9.25 |
60% |
3 |
|
California |
$20.40 |
$12.00 |
59% |
4 |
|
Colorado |
$20.34 |
$11.10 |
55% |
9 |
|
Connecticut |
$22.56 |
$10.10 |
45% |
28 |
|
Delaware |
$19.18 |
$8.75 |
46% |
26 |
|
Florida |
$16.62 |
$8.46 |
51% |
15 |
|
Georgia |
$17.28 |
$7.25 |
42% |
40 |
|
Hawaii |
$20.42 |
$10.10 |
49% |
19 |
|
Idaho |
$16.47 |
$7.25 |
44% |
31 |
|
Illinois |
$19.21 |
$8.25 |
43% |
35 |
|
Indiana |
$17.18 |
$7.25 |
42% |
38 |
|
Iowa |
$17.84 |
$7.25 |
41% |
43 |
|
Kansas |
$17.28 |
$7.25 |
42% |
40 |
|
Kentucky |
$16.66 |
$7.25 |
44% |
32 |
|
Louisiana |
$16.05 |
$7.25 |
45% |
27 |
|
Maine |
$17.85 |
$11.50 |
64% |
1 |
|
Maryland |
$21.49 |
$10.10 |
47% |
24 |
|
Massachusetts |
$23.40 |
$12.00 |
51% |
13 |
|
Michigan |
$18.08 |
$9.25 |
51% |
14 |
|
Minnesota |
$20.49 |
$9.86 |
48% |
22 |
|
Mississippi |
$14.70 |
$7.25 |
49% |
20 |
|
Missouri |
$17.33 |
$8.60 |
50% |
18 |
|
Montana |
$16.87 |
$8.50 |
50% |
17 |
|
Nebraska |
$17.85 |
$9.00 |
50% |
16 |
|
Nevada |
$17.09 |
$8.25 |
48% |
21 |
|
New Hampshire |
$19.17 |
$7.25 |
38% |
47 |
|
New Jersey |
$20.96 |
$8.85 |
42% |
37 |
|
New Mexico |
$16.40 |
$7.50 |
46% |
25 |
|
New York |
$21.63 |
$11.10 |
51% |
12 |
|
North
Carolina |
$17.19 |
$7.25 |
42% |
39 |
|
North
Dakota |
$19.87 |
$7.25 |
36% |
50 |
|
Ohio |
$17.96 |
$8.55 |
48% |
23 |
|
Oklahoma |
$16.62 |
$7.20 |
43% |
33 |
|
Oregon |
$19.03 |
$10.75 |
56% |
6 |
|
Pennsylvania |
$18.49 |
$7.25 |
39% |
46 |
|
Rhode
Island |
$20.21 |
$10.50 |
52% |
11 |
|
South
Carolina |
$16.23 |
$7.25 |
45% |
30 |
|
South
Dakota |
$16.08 |
$9.10 |
57% |
5 |
|
Tennessee |
$16.78 |
$7.25 |
43% |
34 |
|
Texas |
$17.84 |
$7.25 |
41% |
43 |
|
Utah |
$17.69 |
$7.25 |
41% |
42 |
|
Vermont |
$19.10 |
$10.78 |
56% |
7 |
|
Virginia |
$19.63 |
$7.25 |
37% |
49 |
|
Washington |
$22.17 |
$12.00 |
54% |
10 |
|
West
Virginia |
$15.69 |
$8.75 |
56% |
8 |
|
Wisconsin |
$18.25 |
$7.25 |
40% |
45 |
|
Wyoming |
$19.34 |
$7.25 |
37% |
48 |
|
Source:
Occupational Employment Statistics from BLS |
||||
How does the minimum wage compare to the median wage?

Colorado’s minimum wage has grown compared to the median wage. In 2006, the minimum wage was just one-third of the median wage, but by 2018 that number rose to 50%. Since 2001, the minimum wage has nearly doubled while the median wage has increased by less than half that amount. Assuming similar median wage growth between 2018 and 2019, the ratio between the minimum wage and the median will likely be over 55%. It’s clear that wage growth for middle class families is still an issue, despite relatively strong wage growth for those who work low wage jobs.
What about the tipped minimum wage?
Colorado tipped minimum wage has more than quadrupled since 2006 – growing 322% while the minimum wage has grown a more modest 133%. That’s because the tipped minimum wage is set to $3.02 less than the minimum wage. In 2020, the minimum wage will be $12 and the tipped minimum wage will be $8.98.

Have increases in the tipped minimum wage impacted the cost of going out to eat? The “food away from home” component of the consumer price index provides useful clues as to the answer. The below table examines the “food outside the home” component of CPI since 2002 in both Denver and Phoenix, both of which had moderate minimum wage increases in 2007 and 2017.

The “food away from home” component of CPI averages about a 2.3% increase in years when the minimum wage didn’t increase moderately. In Colorado that number was 4.8% in both 2007 and 2017 when the state raised the minimum wage. Assuming a 2.5% increase in prices at restaurants can be contributable to the minimum wage increases, that means a $20 burger and beer costs an extra 50 cents because of the minimum wage increase.
Is Colorado’s minimum wage driving higher inflation?

Colorado’s prices have outpaced the nation in recent years, but most of the blame falls on the steep rise in housing costs in the last five years. The housing component of the CPI makes up 42% of the overall inflation rate, whereas the “food away from home” component drives less than 6%.

Appendix

|
Low
Wage Jobs in 50 States |
|||||||
|
Low Wage Threshold |
Portion “Low Wage” |
Rank |
Low Wage Threshold |
Portion “Low Wage” |
Rank |
||
|
Alabama |
$11.16 |
26.8% |
22 |
Montana |
$13.36 |
32.8% |
9 |
|
Alaska |
$16.24 |
27.7% |
20 |
Nebraska |
$11.35 |
18.0% |
48 |
|
Arizona |
$12.13 |
24.1% |
33 |
Nevada |
$13.56 |
33.3% |
7 |
|
Arkansas |
$10.86 |
25.6% |
26 |
New
Hampshire |
$13.71 |
27.4% |
21 |
|
California |
$18.96 |
44.9% |
2 |
New
Jersey |
$15.64 |
33.2% |
8 |
|
Colorado |
$13.20 |
23.3% |
36 |
New
Mexico |
$10.94 |
24.4% |
32 |
|
Connecticut |
$15.96 |
30.5% |
12 |
New
York |
$17.39 |
36.8% |
4 |
|
Delaware |
$13.51 |
28.9% |
16 |
North Carolina |
$11.86 |
26.8% |
23 |
|
Florida |
$12.24 |
29.0% |
15 |
North
Dakota |
$12.35 |
17.4% |
49 |
|
Georgia |
$11.15 |
24.6% |
31 |
Ohio |
$11.35 |
21.8% |
41 |
|
Hawaii |
$24.11 |
58.9% |
1 |
Oklahoma |
$10.88 |
23.4% |
35 |
|
Idaho |
$11.54 |
25.6% |
27 |
Oregon |
$16.78 |
39.9% |
3 |
|
Illinois |
$11.81 |
21.9% |
39 |
Pennsylvania |
$12.71 |
26.4% |
25 |
|
Indiana |
$11.25 |
21.9% |
40 |
Rhode
Island |
$14.93 |
30.7% |
11 |
|
Iowa |
$11.26 |
19.3% |
44 |
South
Carolina |
$11.99 |
29.8% |
13 |
|
Kansas |
$11.13 |
21.7% |
42 |
South
Dakota |
$12.48 |
28.3% |
18 |
|
Kentucky |
$11.36 |
25.2% |
29 |
Tennessee |
$11.09 |
23.1% |
38 |
|
Louisiana |
$11.74 |
31.0% |
10 |
Texas |
$11.44 |
23.9% |
34 |
|
Maine |
$14.69 |
34.7% |
5 |
Utah |
$12.30 |
25.1% |
30 |
|
Maryland |
$16.21 |
33.9% |
6 |
Vermont |
$14.31 |
26.6% |
24 |
|
Massachusetts |
$16.45 |
29.7% |
14 |
Virginia |
$12.59 |
25.4% |
28 |
|
Michigan |
$11.11 |
19.0% |
46 |
Washington |
$13.84 |
18.3% |
47 |
|
Minnesota |
$12.70 |
19.2% |
45 |
West
Virginia |
$11.39 |
28.0% |
19 |
|
Mississippi |
$10.76 |
28.6% |
17 |
Wisconsin |
$12.16 |
23.1% |
37 |
|
Missouri |
$10.89 |
20.4% |
43 |
Wyoming |
$11.16 |
15.6% |
50 |
|
Source:
Occupational Employment Statistics from BLS; low wage threshold index to Colorado’s
$13.20 using Missouri Economic Research and Information Center’s Cost of
Living Index Q1 2019 |
|||||||

Methodology and Data Sources
American Community Survey Public Use Microdata Sample (PUMS) offers data that explains much about low-wage work. The survey does not ask a “wages per hour” question. But it does ask about “wages or salary income in past 12 months.” With a combination of two other variables, wages per hour can be derived using “usual hours worked per week in past 12 months” and “weeks worked during past 12 months.” An additional step is required to translate categorical variables to continuous. For example, if a survey respondent reported working 50 to 52 hours each week, which was translated into a continuous variable of 51 hours a week.
The 2017 PUMS data set for Colorado had 55,600 samples. Among that total were 24,609 samples that reported wage income and reported working at least 10 weeks last year. Among them were 7,530 low-wage workers, derived from taking out anyone under 15 years old, not working, or working and making more than $12.90 an hour (the low wage threshold for 2017). From the sample of 24,609 we calculated the portion of respondents whose “wage per hour” variable was less than $12.90. We did this for the total workers as well as by race, sex, age, and hours worked.
Current Population Survey Data is used in this report to track wage quintile data over time. We utilize the Economic Policy Institute’s analysis of Current Population Survey data to look at wages by decile. Wages are adjusted for inflation using the Denver-Boulder-Greeley CPI.
Current Population Survey data is a different source than Occupational Employment Statistics available from the Bureau of Labor Statistics. For example, 23 percent of Colorado jobs pay less than $13.20, but 27 percent of workers report making less than that “low wage” threshold on the Current Population Survey.
The May 2018 Current Employment Statistics data was the most recently available at the time of this report. “Low-wage” jobs were categorized as those whose median wage was less than $13.20 an hour in 2018.
To compare Colorado’s wages to other states, we first adjusted for the difference in costs of living across states. Put simply, $13.20 an hour goes further in Mississippi than it does in Colorado.
To account for the difference across states in cost of living, we adjusted that $13.20 wage threshold by a cost of living index. We relied on the Missouri Economic Research and Information Center’s Cost of Living Index, which examined six living expenses including house, groceries, utilities, transportation, healthcare and miscellaneous expenses. The overall cost of living index was used to adjust the purchasing power of $13.20 in Colorado to the rest of states.
With the low-income wage thresholds calculated, OES data was used to determine what portion of jobs pay less than that threshold and are thus categorized as “low-wage.” The table below shows the results.
You can find EPI’s full methodology of wages and wage percentiles at http://www.epi.org/data/methodology/
You can find a full methodology of OES data at